Dashboard
The Dashboard is the main page that appears after successfully logging into JOVA POS.
This page serves as a central information summary and navigation hub, allowing users to monitor business conditions and switch between features quickly.
Dashboard Purpose
The dashboard helps users to:
- Quickly view transaction and sales summaries
- Monitor store performance for a selected period
- Access main operational menus faster
- Reduce mistakes since all important information is available in one place
Dashboard Overview
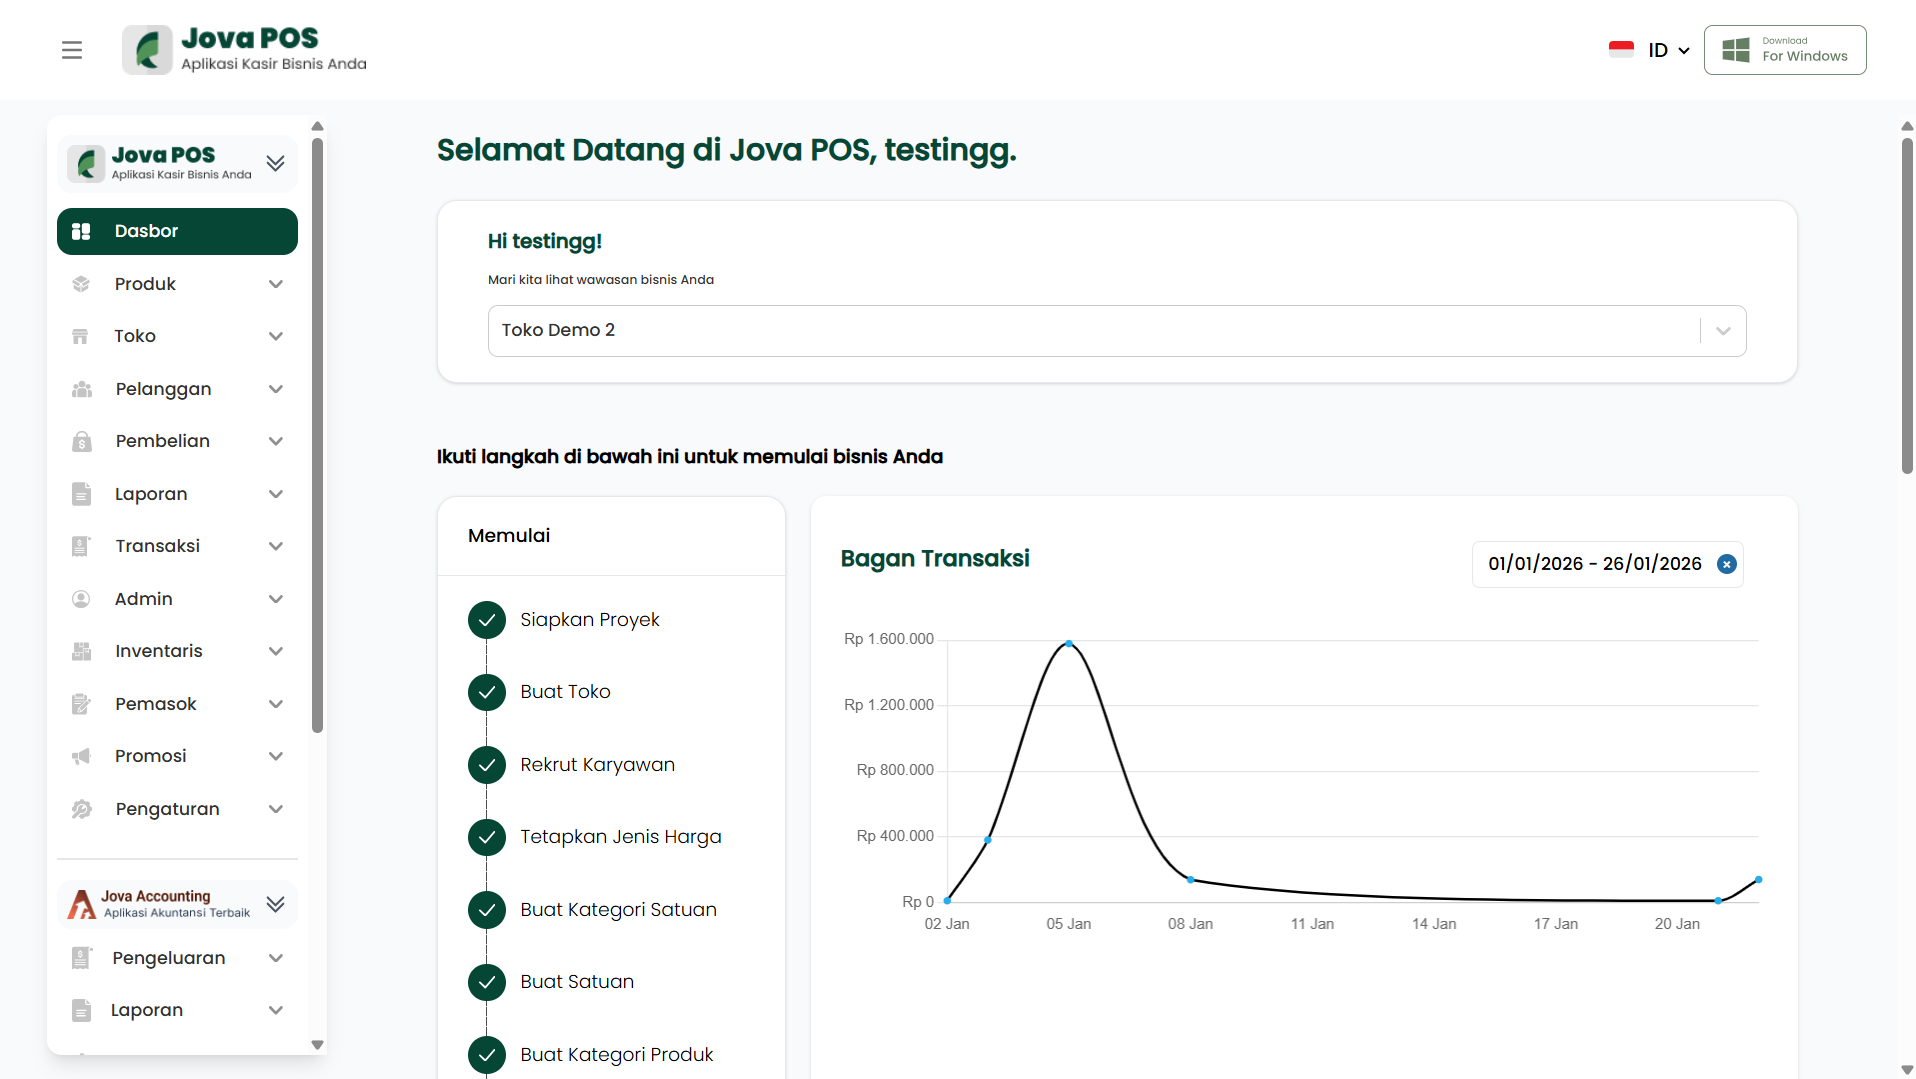
Dashboard Sections
1. Navigation Sidebar
The sidebar is located on the left side and functions as the main menu for navigating between pages.
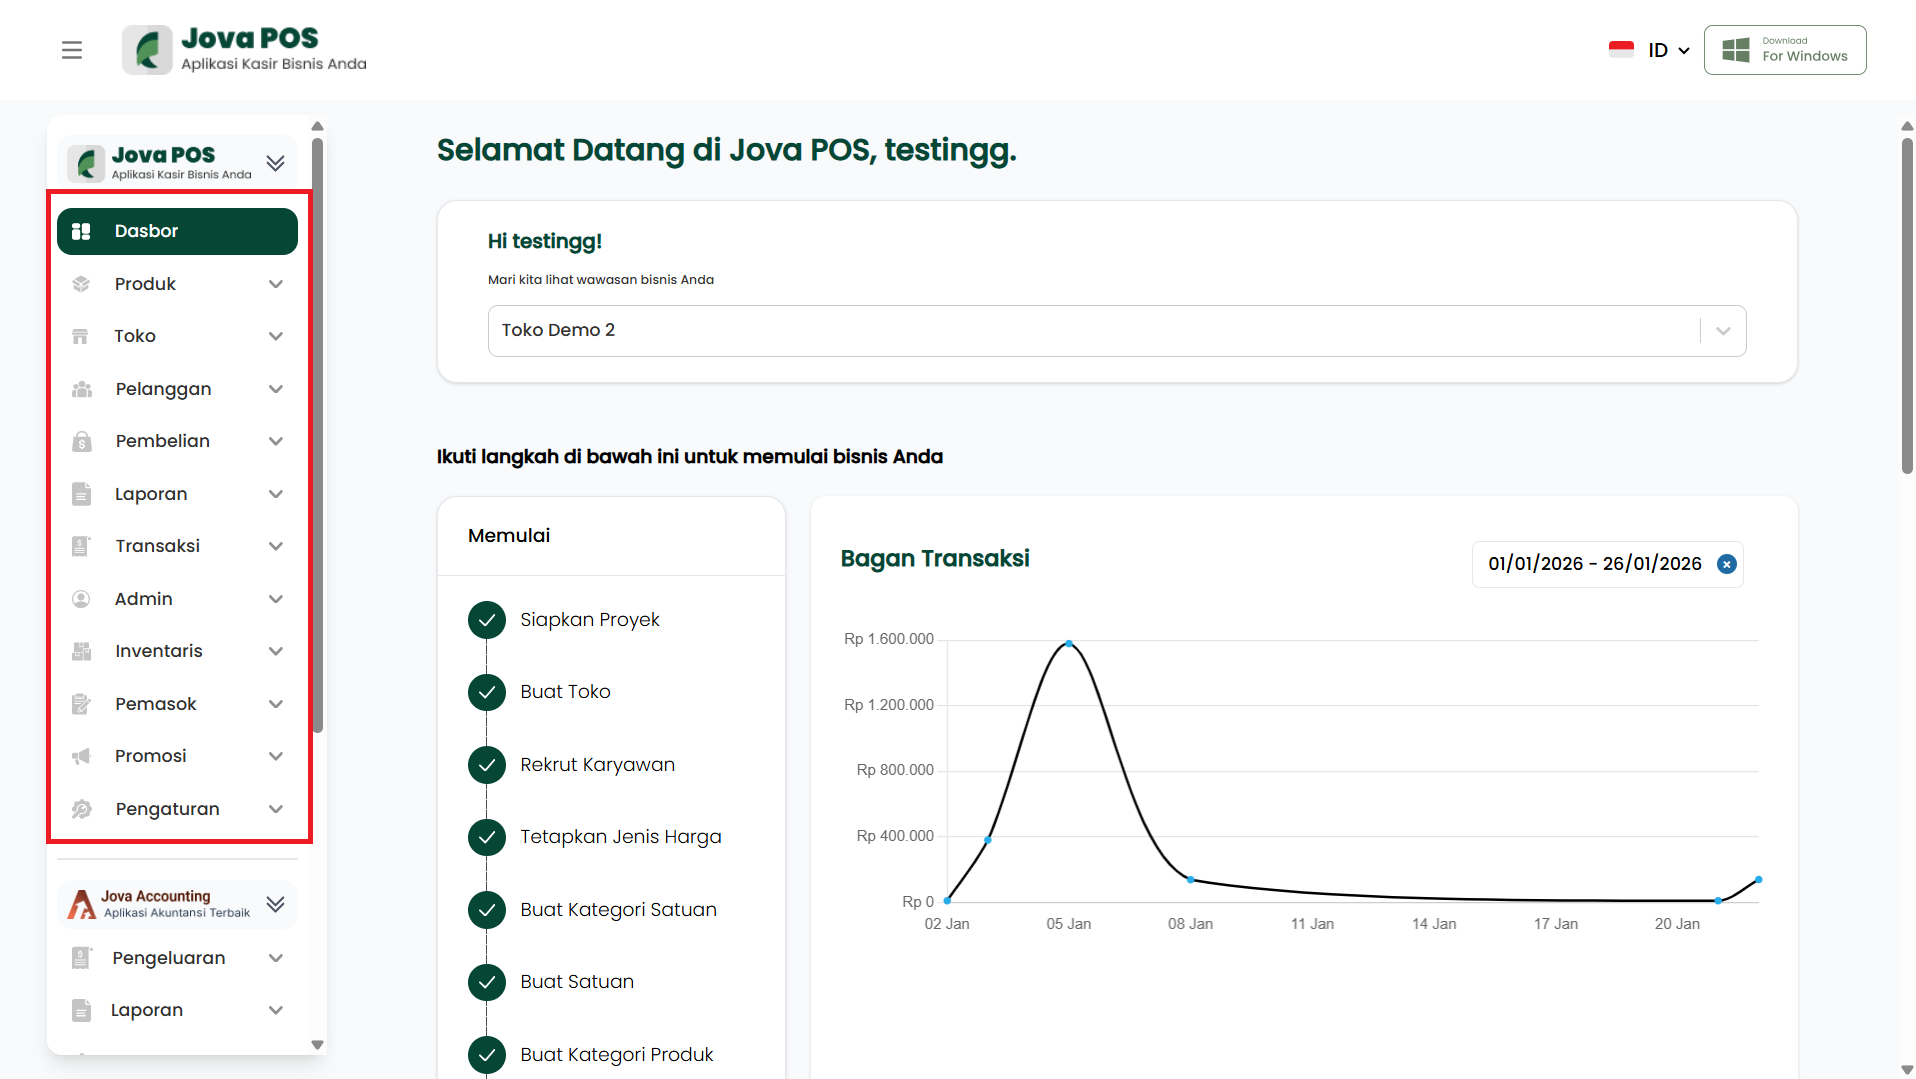
Visible menu items:
- Dashboard
- Products
- Stores
- Customers
- Purchases
- Reports
- Transactions
- Admin
- Inventory
- Suppliers
- Promotions
- Settings
Sidebar functions:
- Easy access to features without returning to the main page
- Speeds up cashier/admin workflow
- Reduces misclicks due to consistent menu structure
2. Top Bar
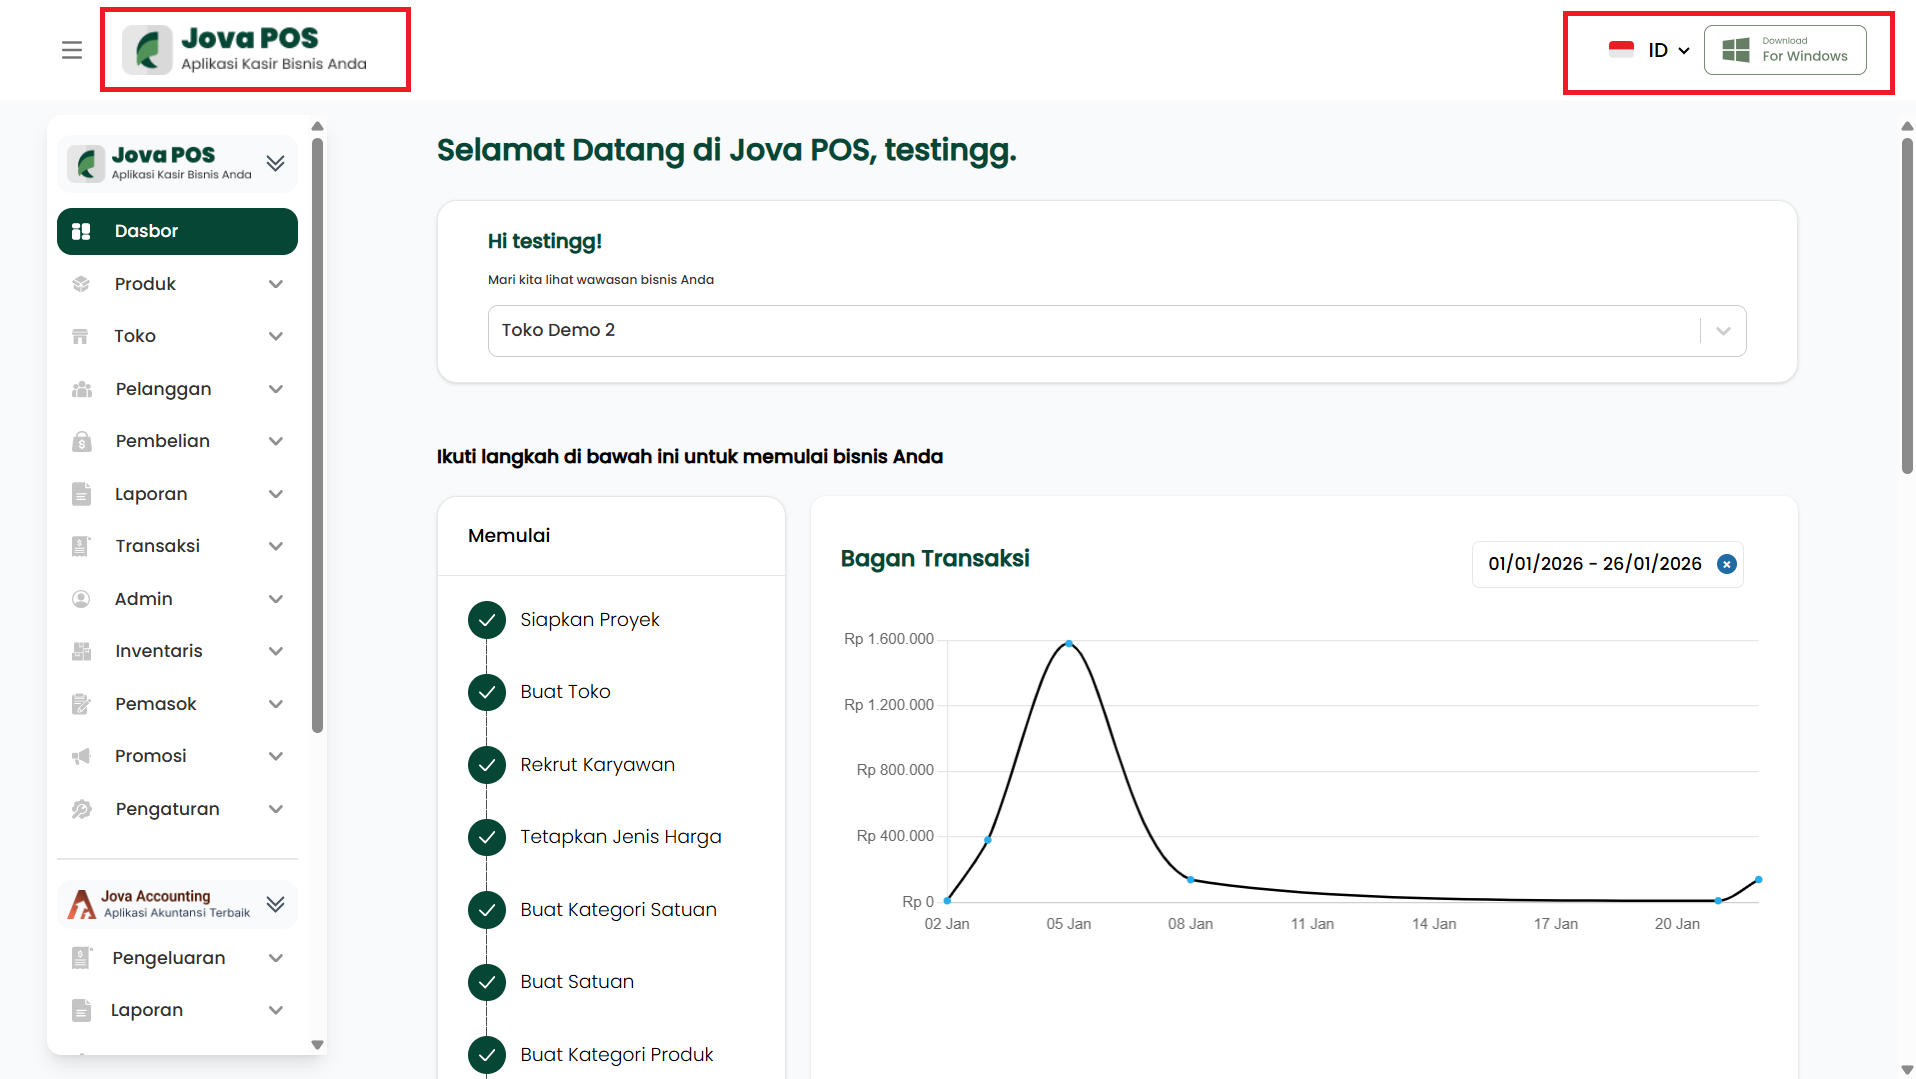
The top section displays several important components, generally:
- Jova POS Logo
- Language selection (e.g. ID)
- Download For Windows button
- Additional buttons/menus (if available)
Header functions:
- Quick access to global settings (e.g. language)
- Access to download the desktop application (if used)
3. User Greeting and Store Selection
The main area of the page displays:
- A greeting text, e.g.: "Welcome to Jova POS, testingg."
- An info box with "Hi testingg!"
- Store selection dropdown (e.g. Demo Store 2)
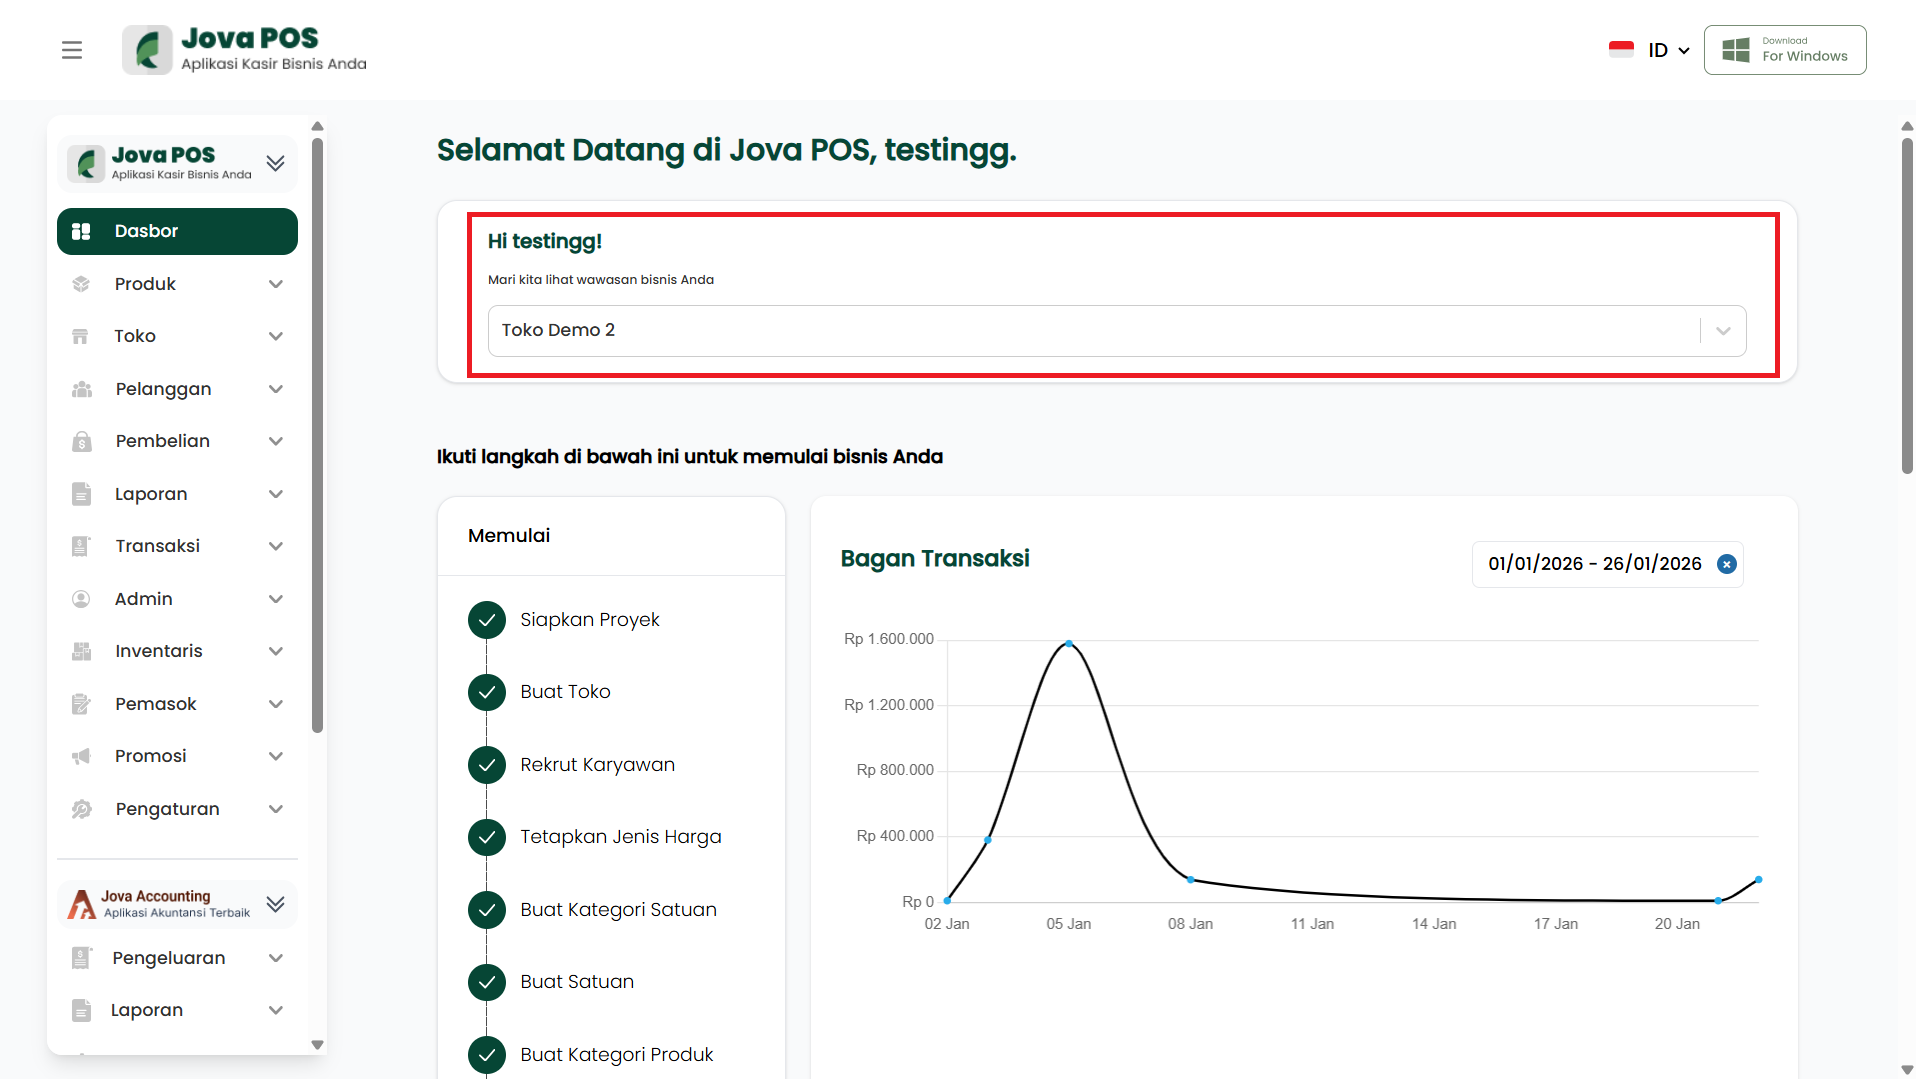
Store selection functions:
- Determines the active store whose data will be shown on the dashboard
- Makes it easy for business owners with multiple stores
If the displayed data does not match, make sure the selected store in the dropdown is correct.
4. "Getting Started" Checklist (Initial Setup Guide)
The Getting Started section lists steps to prepare the system for operation.
Example visible items:
- Set Up Project
- Create Store
- Recruit Employees
- Set Price Type
- Create Unit Category
- Create Unit
- Create Product Category
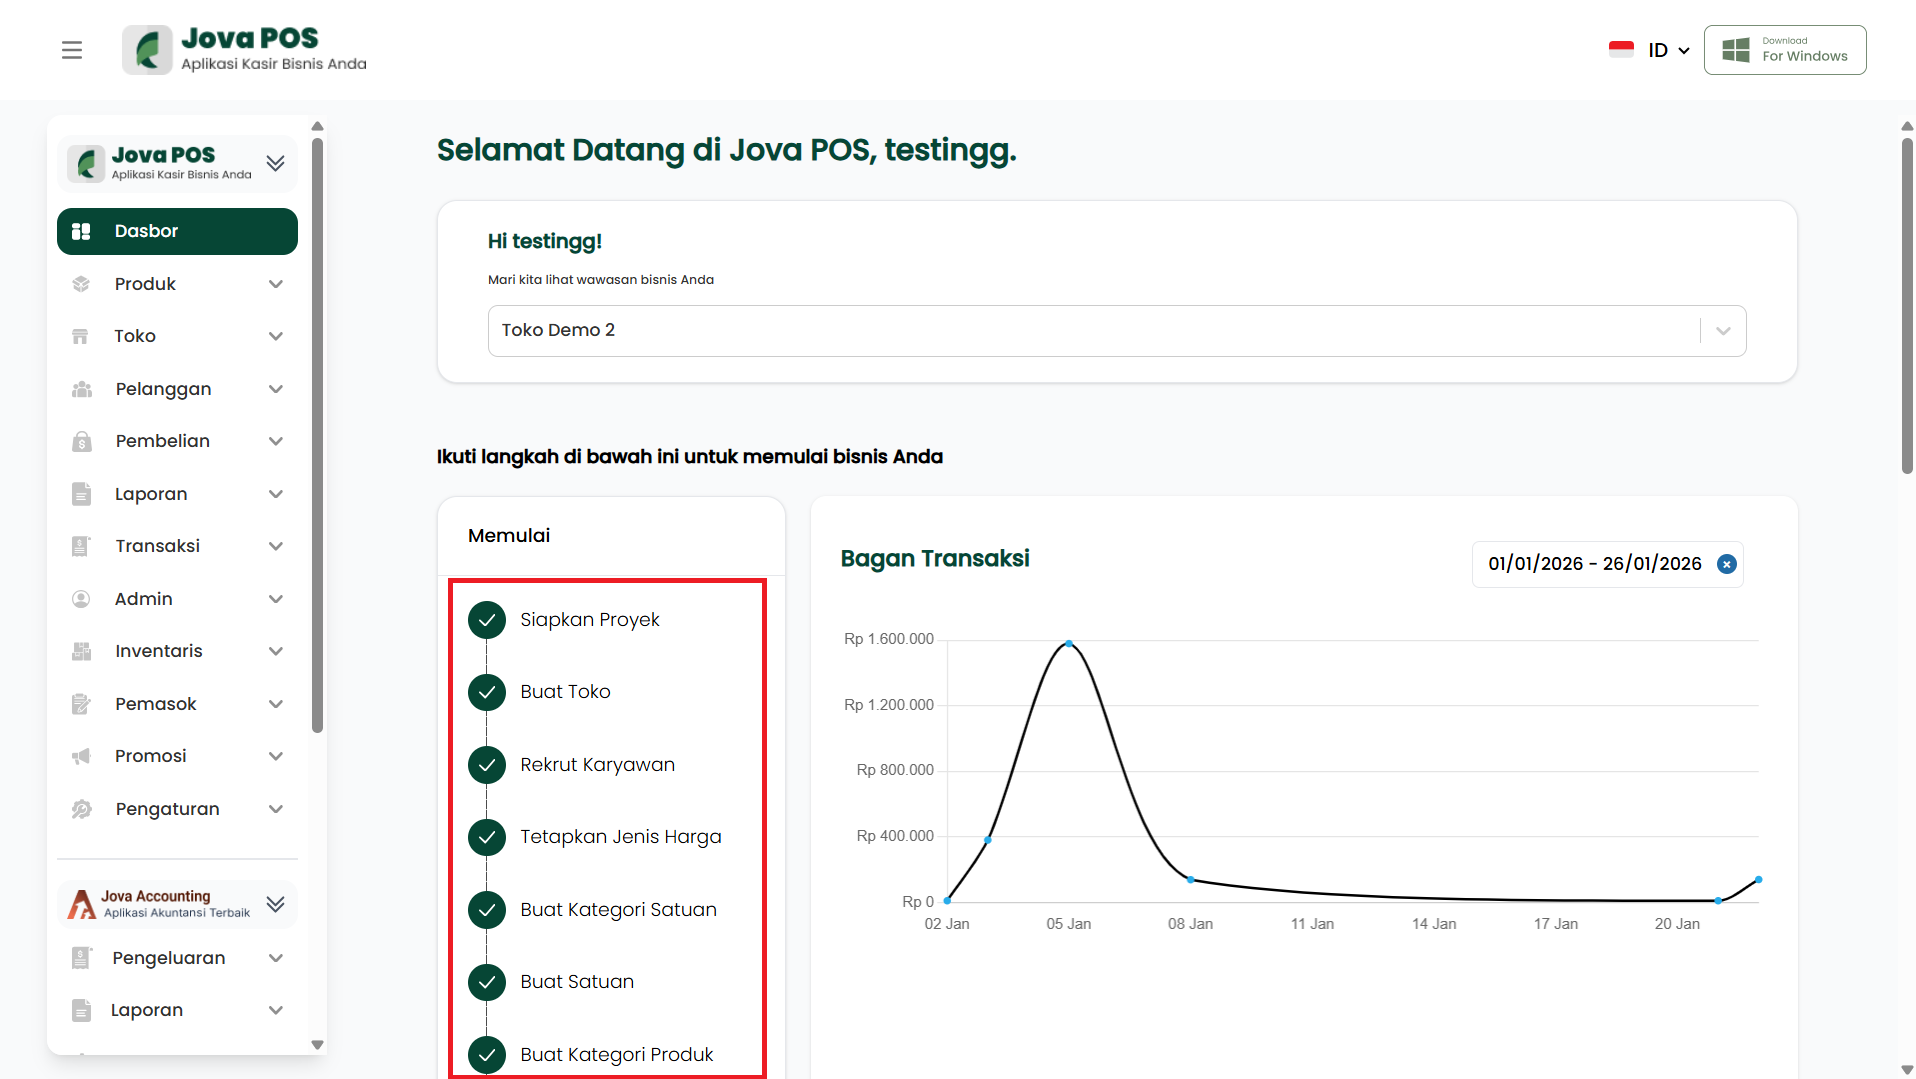
Checklist functions:
- Helps new users complete important configurations
- Reduces operational risks (e.g. transactions performed before product/unit data is ready)
5. Transaction Chart (Graph)
The Transaction Chart section displays transaction trends in graphical form.
Available components:
- Transaction graph (visual)
- Date range filter (e.g.
01/01/2026 - 26/01/2026)
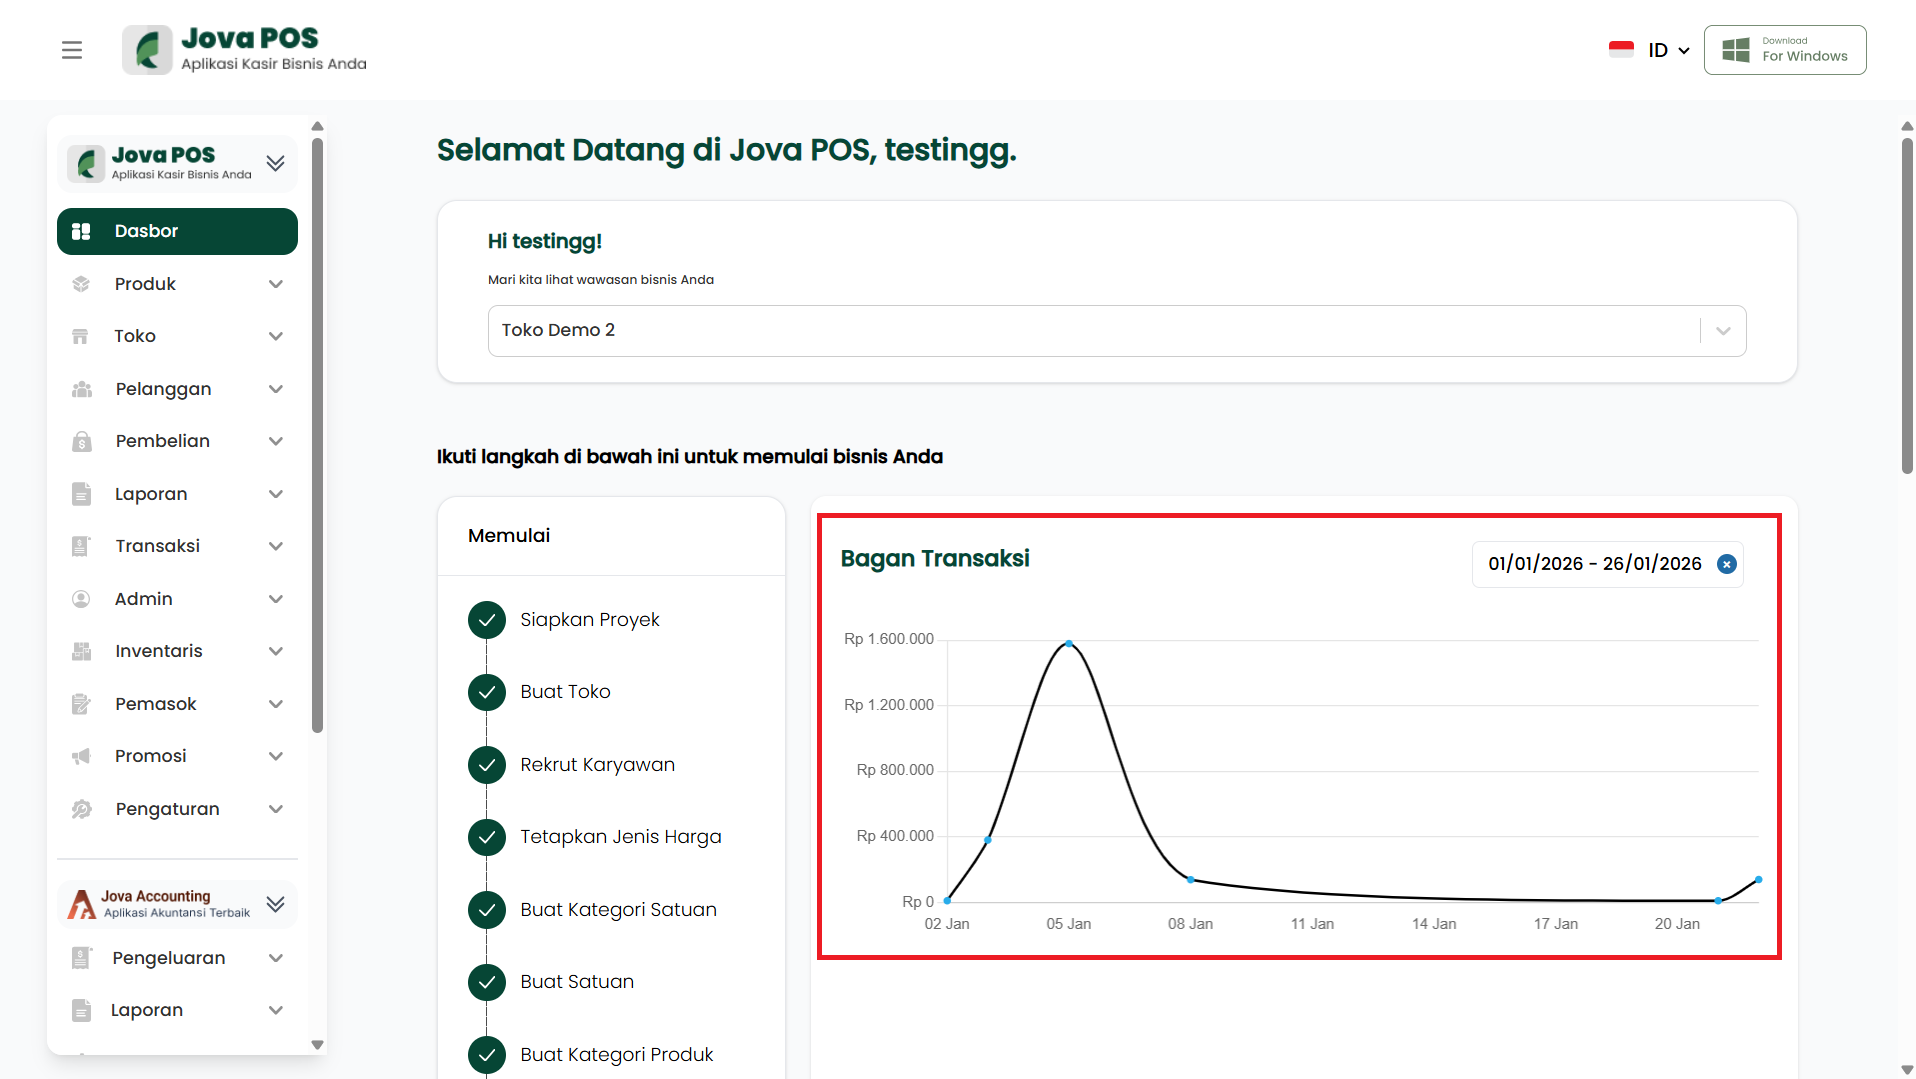
Benefits of the transaction chart:
- Monitor transaction trends over a specific period
- Identify busy and slow days
- Helps evaluate promotion and operational strategies
Change the date range to view data for a different period.
Dashboard and Transaction Menu Relationship
The dashboard displays summaries and visuals. To view transaction details, users need to go to the Transactions menu.
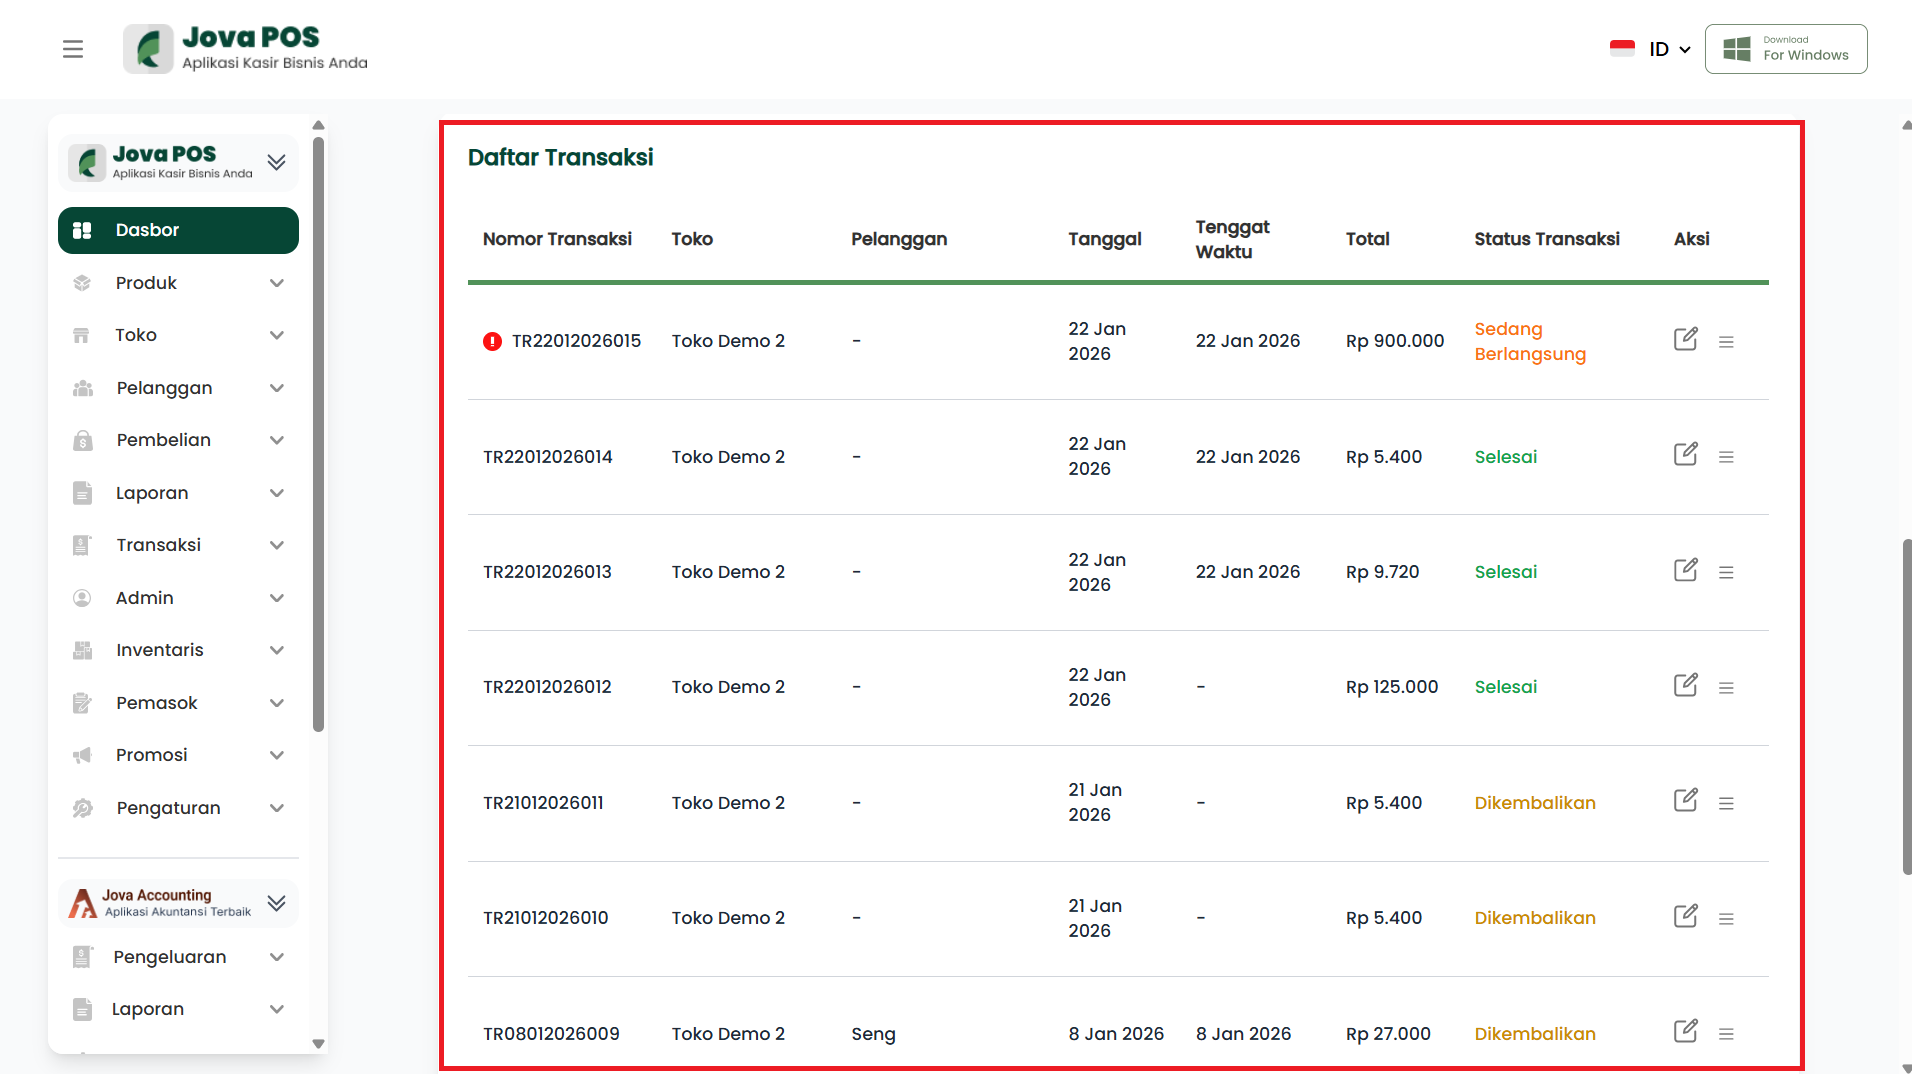
On the Transaction List page, users can view data such as:
- Transaction Number
- Store Name
- Customer
- Date and Due Date
- Total
- Transaction Status (Ongoing, Completed, Returned)
- Actions (view details/edit)
Dashboard Access Rights by Role
The dashboard display may differ depending on the user role.
| User Role | General Access Rights |
|---|---|
| Admin | Full menu access and data summary |
| Cashier | Focus on transactions and operational information |
| Owner | Focus on performance summary and reports |
If a menu is not visible, your account may have limited access rights.
Dashboard Usage Flow
Login
  ↓
Dashboard
  ↓
Select Store (if any)
  ↓
Monitor Checklist & Transaction Chart
  ↓
Select Menu (Products / Transactions / Reports / etc.)
  ↓
Complete Activity
  ↓
Return to Dashboard